Software Specification
Ortmaster ORTM-4
11/08/09 - PES
The Ortmaster system is intended to read currents encountered in recloser testing, and determine true RMS values for each current pulse, and measure the time of each pulse. It should do essentially all functions presently performed by the MSDOS program ORTRUN, but in a Windows environment. It also adds test setup, results, and analysis functions that were previously performed by the separate TCC.EXE program.
Executable file:
The program may be invoked with command line switches, as follows:
Old TCC Mode:
If the file name of the executable is changed to "ORTRUN.EXE", it will emulate the old MSDOS ORTRUN file so that the old TCC.EXE may be used with the new program.
Setup:
The first task for the software will be to check for all required files. If any is missing, a default file will be created, or a Message Box will appear with the name of the missing file, and the program will terminate when OK is pressed.
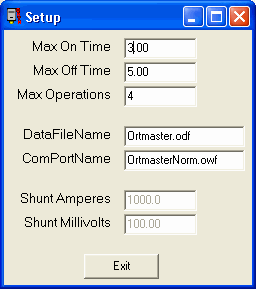
The software will then read a setup file Ortmaster.osf.
If any value is out of range, a Message Box will appear, saying "Setup File Corrupted", and a default file will be generated when user presses OK.
This file is also be used by another program, TCC, which will normally be the application first run by the user. Note: The COM port returned from the Ortmaster program will be the port detected and used. If run in DEMO mode, it will return the demo waveform file name.
The Windows based software will then attempt to open the specified COM port (if it is a valid port name) and communicate with the ORTM-4 hardware. If the hardware is not found, the program will search for a COM port with hardware connected. If none is found, it will enter DEMO mode, which will prompt the user for an Ortmaster Wave File for normal or Minimum Pickup Operation (OrtmasterNorm.OWF or OrtmasterMPU.owf). The user may select from a list of available files.
If communication is established, the software will read the calibration data from the PIC program memory. If the read is successful, it is written to the calibration file Ortmaster.ocf. Otherwise, a Calibration Error is displayed and default cal values are used. Saved test results will be set to negative if default calibration is used. Calibration error may be cleared by entering the calibration menu or by restarting the program.
There is a Calibration Status panel which will appear in GREEN with the calibration date if OK. It will change to YELLOW and give a warning if calibration is due within 30 days. If past due, or if default values are used, it will appear in RED. A double click on this panel will hide it.
In DEMO mode, the values in the calibration file are used, except for the current calibration factors. The waveform file contains a Units per Count value, which is used to determine the range and also the simulated values of current. The range is calculated by multiplying the Units Per Count by the maximum count (2048 for 12 bit data), multiply by 0.707 (for RMS), and divide by 2 (for usual range setting about 1/2 FS). The next higher range is selected. If the computed range differs from that specified in the setup file, a prompt will appear "OK to Change Range?". OK changes range to match waveform file, NO keeps range as specified in setup file.
Main Form:

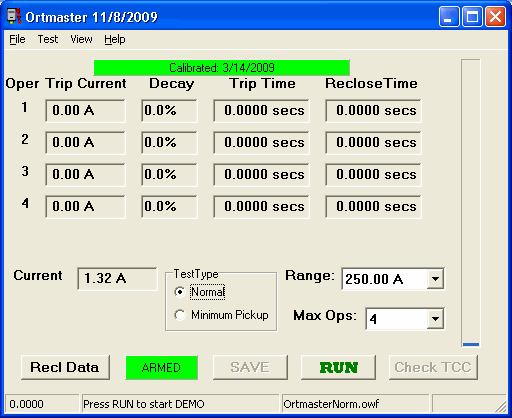
The main elements on the display window will be:
Main Menu Status Bar
The first status bar panel (lower left corner) is a running time indicator of how long the software has been sampling input data. It is reset to zero when the Reset button is clicked.
The middle status bar panel provides prompts to the user about what to do and what is going on:
When the test has completed or it has been stopped by the user, this panel may read the following:
The third panel indicates the waveform file being used, or the Serial number of the attached Ortmaster and the COM port it is using.
The fourth panel simply indicates if the COM port is ON (sampling) or OFF.
Current Indicator Progress Bar
This vertical bar on the right side of the display shows the continuous peak current flow as a percentage of full capacity. If it reaches close to maximum, it may be best to change range to avoid overrange errors.
Trip Current Column
Values in these read only edit boxes indicate the true RMS value of each trip operation of the recloser.
Decay Column
Values in these read only edit boxes indicate the percentage drop in RMS value for each trip operation of the recloser, based on maximum vs total RMS.
Trip Time Column
Values in these read only edit boxes indicate the elapsed time of each trip operation of the recloser.
Reclose Time Column
Values in these read only edit boxes indicate the elapsed time of each reclose operation of the recloser.
Test Type Group
These radio buttons allow selection of full cycle test or Minimum Pickup.
Range Drop Down Control
This provides a list of available ranges which may be selected. It is enabled only when not sampling.
Max Operations Drop Down Control
This provides a list of 1 to 5 operations which may be selected. It is disabled for minimum pickup (which is always set to 1).
File Open Dialog
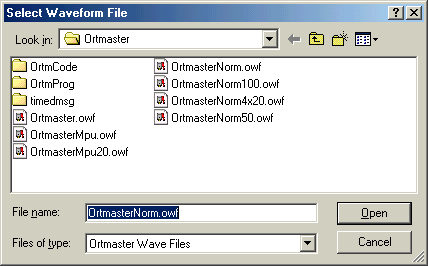
This standard dialog box opens when File | Open is selected from the Main Menu. It will display all available Ortmaster Waveform Files (*.owf), and will also allow old Waveform Files (*.wv), or all files (*.*) The default for normal mode is OrtmasterNorm.owf, and for Minimum Pickup it is OrtmasterMPU.owf. When a waveform file has been selected, it is used for simulation, and the program enters DEMO mode.
Setup Form
Calibration Password Dialog Box
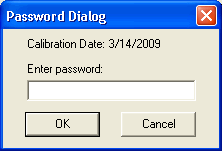
This small dialog box appears by selecting File | Calibration from the main menu. It shows the date when the system was last calibrated, and prompts for entry of the predefined Ortmaster System password, which is presently 4889. A different password may be supplied for distributed versions of the software.
Calibration Form
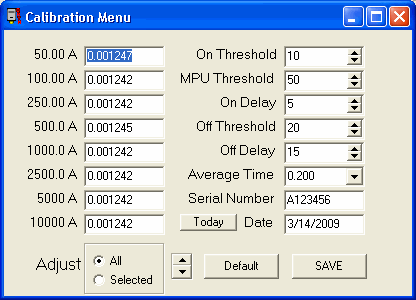
This form displays current calibration values for all ranges on the left side. They may be individually edited or simultaneously adjusted up and down by means of the Adjust All or Adjust Selected Up/Down arrows below the list. For Adjust Selected, click on the desired edit box. On the right side are spin edit controls for the five values that help determine when current starts and stops. They have preset minimum and maximum values.
The On Threshold is the number of ADC counts that signify start of current. A low value will be more sensitive; a high value is more noise tolerant.
The MPU Threshold is the number of ADC counts that signify start of current for Minimum Pickup testing. A low value will be more sensitive; a high value is more noise tolerant. This value is typically two to five times the normal On Threshold.
The On Delay is the number of samples (at 2400/second) that current must be above the On Threshold before start of current is determined. A high value is more noise tolerant. Timing is only minimally affected, as a pretrigger buffer includes previous samples.
The Off Threshold is the number of ADC counts that signify current is off. A low value will be more sensitive; a high value is more noise tolerant.
The Off Delay is the number of samples (at 2400/second) that current must be below the Off Threshold before end of current is determined. A high value is more noise tolerant. Timing is only minimally affected, as extra samples are ignored.
The Average Time edit box may be set to any value from 0.050 to 0.250 seconds. The 0.050 second choice provides fastest update for Min Pickup tests.
The Serial Number is a maximum of 12 characters, and normally is set to the serial number or calibration control number of the Ortmaster.
The Date edit box allows entry of a calibration date. The Today button inserts the present date.
The Default button fills in the default values as a starting point for initial calibration.
The Save button stores the displayed values in PIC program memory as well as the Ortmaster.ocf file. Message Boxes warn about writing to PIC memory and the file, and each operation may be aborted. Closing the form ignores any changes entered. A warning message should be displayed in this case.
Waveform Display Form
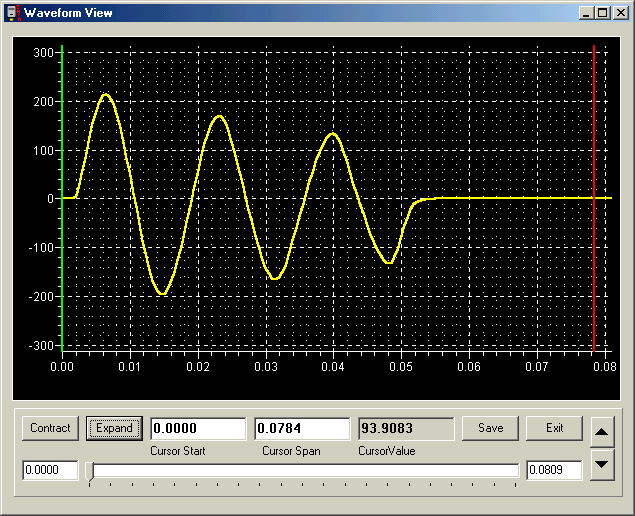
The Waveform Display Form is accessed by selecting the View | Waveform from the main Menu, after test results have been computed and displayed. The waveform screen will appear with a view of the first 1 second of the test. A series of buttons at the bottom of the screen allow several functions to be performed, as follows:
Contract Contracts the waveform by a factor of 2, to see a longer time
Expand Stretches the waveform to show what is between the cursors
Save Opens a save dialog box to create a file to save the waveform
Exit Exit without saving (same as form close)
The mouse may be left-clicked on a part of the waveform to set the green cursor at that time point, and a right-click will similarly set the red cursor.
A slider control may be used to position the waveform as desired, and edit boxes are provided to manually enter start and end times for the display.
The UP and DOWN arrows to the right may be clicked to expand or contract the waveform display vertically.
The Cursor Start Edit Box is the time where the green cursor is located, and the Cursor Span is the time between the cursors. These may be edited to analyze a specific portion of the waveform. The Cursor Value read only edit box shows the true RMS value represented by that portion of the waveform.Comm Status Form
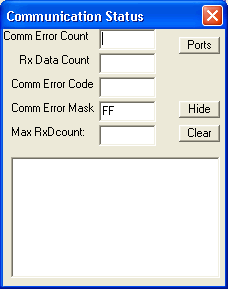
The Communication Status Form is accessed by selecting View | Comm Status from the main Menu. The Comm Error Count indicates how many times a communication error occurred, which usually indicates a missed character. This form will appear any time this happens. The Rx Data Count is the number of characters in the secondary receive buffer waiting to be processed on the Main Form Update event, which occurs about 5 times a second, so this number may vary up to about 800 at 4800 characters per second. The Comm Error Code indicates an error such as parity or framing. If they occur frequently, and without cause, as happens with some USB/Serial adapters, the Comm Error Mask may be set to ignore these errors. The text boxes below show the status messages from the Serial Port component. The Ports button shows the Com Ports that are available. The Hide button will close the form only if the Comm Error Count is manually cleared with the Clear button.
Debug Information Form
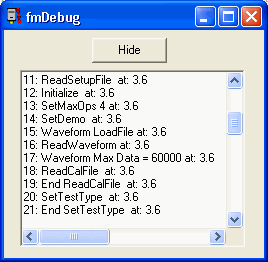
The Debug Information Form is accessed by selecting View | Debug Info in the main menu. The memo control shows the sequence of critical operations that have occurred from the start of the program, and the time (to 100 mSec) at which they occurred.
Recloser Data Form
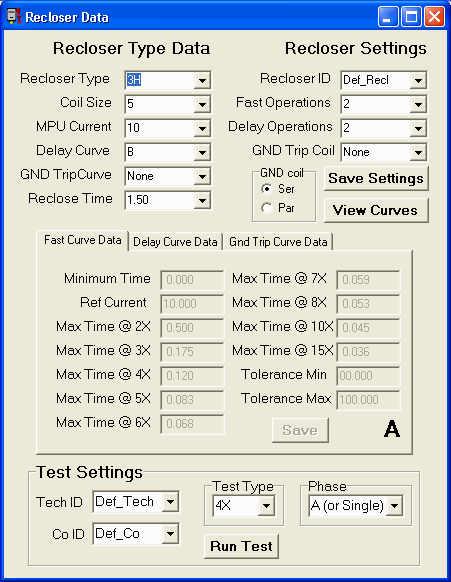
This is the form where information about the recloser and the tests to be performed are entered and displayed.
The Recloser Type combo box selects among all recloser types that are supported by the software. Other recloser types may be entered, although test results may not be analyzed properly.
The Coil Size combo box selects among coil sizes supported by the software. Other coil sizes may be entered, although test results may not be analyzed properly.
The MPU Current combo box defaults to 2x coil size, but may be edited for non-standard minimum pickup values.
The Delay Curve combo box selects among curves supported by the software. Other curves may be entered, although test results may not be analyzed properly.
The GND Trip Curve combo box selects among curves supported by the software. Other curves may be entered, although test results may not be analyzed properly.
The Reclose Time combo box selects among standard times of 0.50, 1.00, 1.50, and 2.00 seconds. A non-standard time may be entered.
The Recloser ID combo box selects among all recloser IDs in the database. A new ID may be entered for a recloser not previously encountered. This must be a unique number such as a serial number or property number.
When the Recloser ID is changed to an ID in the database, the values of the information fields will be changed to those saved for that recloser. If it is a new ID, the information fields will need to be updated.
The Fast Operations combo box selects among 0, 1, 2, 3, and 4. If the total number of operations exceeds 4, the number of Delay Operations will be reduced accordingly.
The Delay Operations combo box selects among 0, 1, 2, 3, and 4. If the total number of operations exceeds 4, the number of Delay Operations will be reduced accordingly.
The GND Trip Coil combo box selects among the bushing CTs supported by the software. Other values may be entered.
The GND Coil connection radio group allows selection of Series or Parallel connection.
In the Test Settings group:
The Tech ID combo box selects among the technicians in the database. A new Tech ID may be entered.
The Co ID combo box selects among the companies in the database. A new Co ID may be entered.
The Test Type combo box selects among MPU, 3x, 4x, 5x, 6x, 8x, and 10x. Other multiples may be entered, although test results may not be analyzed properly.
The Phase combo box selects among A (or single), B, C, or G (ground trip).
The Recloser Time/Current Curve information is displayed in tabbed controls for Fast, Delay, and Ground curves. Each of these have the following edit boxes:
Minimum Time: Used to provide a minimum time for definite time delay curves. Set to zero for other curve types.
Ref Current: Used as a reference point for other curve points. Usually set to the coil size, but may be 1/2 minimum pickup for GND curves.
Time at 2x: This is the time value of the curve at 2x the reference current. This is a maximum time for Fast curves and Definite Delay curves, and Optimum times for delay curves.
Time at 3x to Time at 15x: Curve points as above for multiples of 3, 4, 5, 6, 7, 8, 10, and 15.
Tolerance Min: Lower limit of curve in percent. 100% is for fast curves where all variations are negative. . For most delay curves, this is usually 10%. Set to 0% for definite delay.
Tolerance Max: Upper limit of curve in percent. 0% is for fast curves where all variations are negative, and definite delay where this is an upper limit. For most delay curves, this is usually 10%.
The Save Settings button saves the Recloser settings as entered for the specific recloser according to the unique ID. This includes Tech ID and Co ID.
The View Curves button opens a form that shows the fast and delay curves for the recloser based on the curves and settings of the recloser and the test type. For ground trip test, it shows the fast and delay ground trip curves. The current scale is in multiples of the reference current.
The Run Test button minimizes the Recloser Data form and shows the Main Test form, configured for the test selected. This includes the appropriate range, maximum number of operations, and test type.
Ort Time Current Curve Form
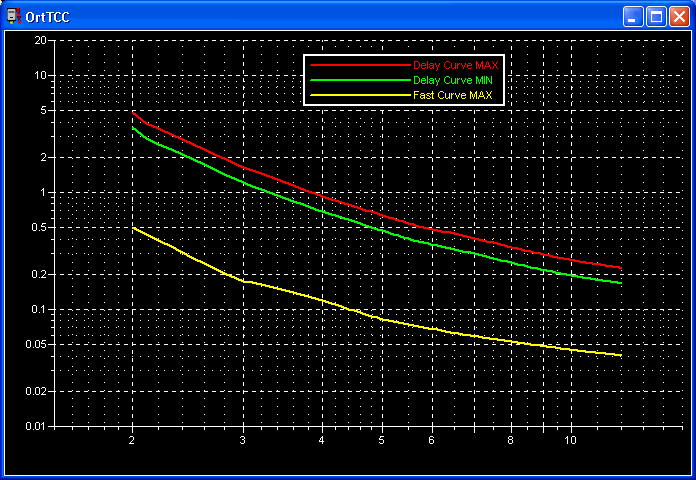
The OrtTCC form shows the curve data in graphical format. The vertical axis is a log scale of time in seconds, while the horizontal axis is a log scale of multiples of the reference current. For these curves, based on a 3H recloser with a 5 amp coil and a type B delay curve, the current ranges from 10 amps (2x) to 60 amps (12x).
Main Form after test
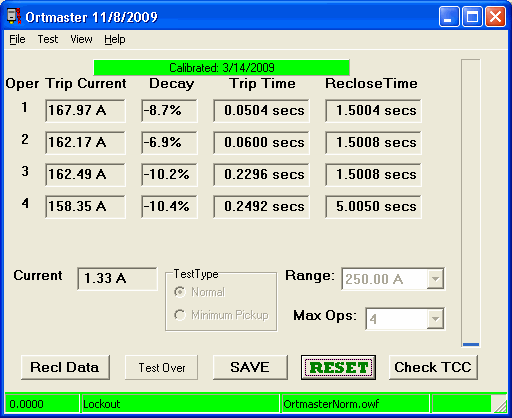
The main form above shows a test for a 3H recloser with 50 amp coil at 3x with two type B delayed operations. These parameters may be set before the test or afterward. Note that this was done using the demo file. The test has completed, and a lockout was determined after waiting the 5 seconds per the maximum OFF time in the setup. Now the Check TCC button is enabled.
Test Results Analysis
The Test Results Analysis form shows the results of the test in the first column. The minimum and maximum values are shown in the second and third columns. These values are determined by the greater of the deviation using 10% of the optimum time and the time using 10% variation in current. The optimum value is in the fourth column. The fifth column is the result, which may be OK, shown in green, High or Low, shown in red, or N/A, shown in gray. The test results that are out of tolerance are shown in red. The Keyboard Input speed button may be clicked which allows manual entry of data in the first column. After entry, click the Analyze button to update the results. The Analyze button may also be clicked after changing test parameters in the Recloser Data form, if they had been entered incorrectly. The Save Results button may be clicked to save the results in a database file, which is in dBase III+ format. This file may be linked to an MS Access database which can provide customized reports.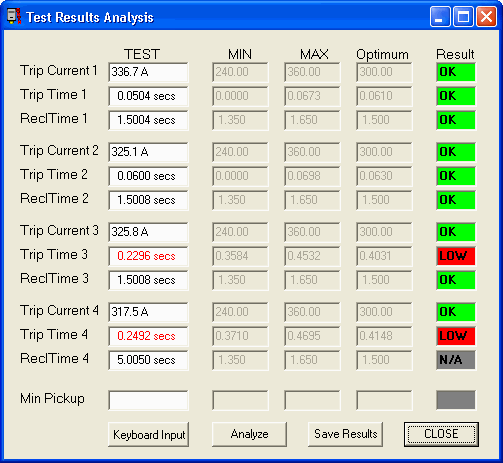
Access 2007 Report
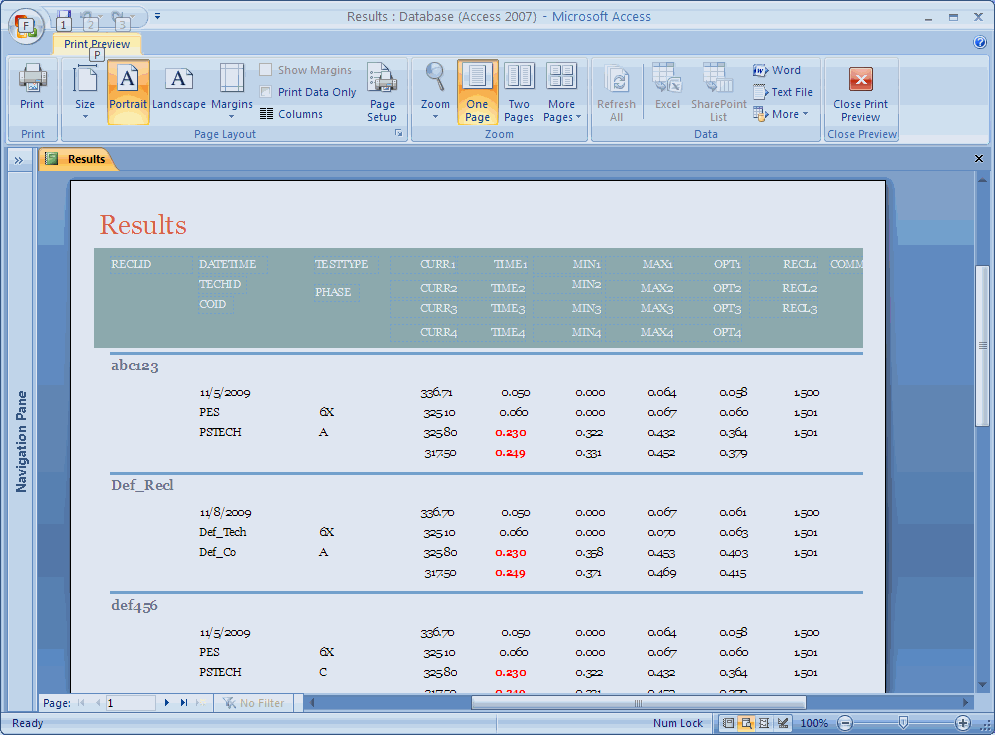
This shows the print preview of an Access 2007 report with the results of the test for the default recloser ID "Def_Recl". Other results are also shown. The report can be customized as needed.
Setup File
NAME TYPICAL VALUE RANGE OF VALUES
========== ============== ==================
Range: 4 1 to 8
Max ON Time: 5.0 0 TO 99 Seconds (0 means no limit)
Max OFF Time: 5.0 0 TO 99 Seconds (0 means no limit)
Data File: Ortmaster.odf Any Valid File Name
COM Port/WaveFile: COM1 Any valid COM port or Waveform File
Normal Max Ops: 4 0 TO 5 (0 indicates MPU)
Test Mode: 0 0=NORM, 1=MINPU (not used by TCC)
ShuntAmps: 1000 10 to 20,000
ShuntMillivolts: 100.0 10.0 to 1000
Data File
Upon exit from the program, data is saved in a file, as named in the setup file Ortmaster.osf, and normally Ortmaster.odf. Decay readings are the ratio of the last complete 1/2 cycle to the total RMS value. The MAX AVERAGE is the minimum pickup current. The format of this ASCII file is as follows:
TRIP CURR 1: 0.00
TRIP TIME 1: 0.0000
RECL TIME 1: 0.0000
TRIP CURR 2: 0.00
TRIP TIME 2: 0.0000
RECL TIME 2: 0.0000
TRIP CURR 3: 0.00
TRIP TIME 3: 0.0000
RECL TIME 3: 0.0000
TRIP CURR 4: 0.00
TRIP TIME 4: 0.0000
RECL TIME 4: 0.0000
TRIP CURR 5: 0.00
TRIP TIME 5: 0.0000
RECL TIME 5: 0.0000
DECAY 1: 1.000
DECAY 2: 1.000
DECAY 3: 1.000
DECAY 4: 1.000
DECAY 5: 1.000
MAX AVERAGE: 0.00
These values may then be stored in a spreadsheet, database, or used by an external program such as TCC.
Debug File
After the setup file is written while exiting from the program, the debug information saved in a file, Ortmaster.dbg.
System Test Procedure